


 Editor: Jon Swenson
 Writer: Max Giese
 Writer: Darryl Hunt
Trend Analysis – Even strength scoring vs. Power play scoring
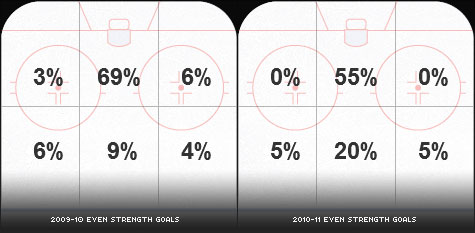
SCORING AREA OF ICE, 2009-10 ES SCORING VS 2010-11 ES SCORING - NHL
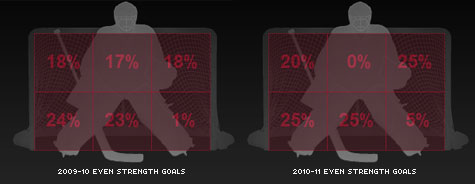
SHOOTING ZONE ON NET, 2009-10 ES SCORING VS 2010-11 ES SCORING - NHL
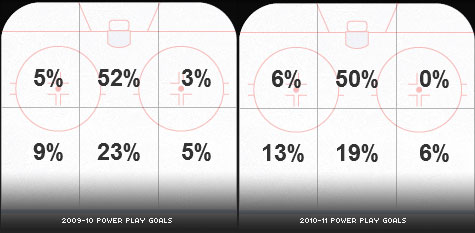
SCORING AREA OF ICE, 2009-10 PP SCORING VS 2010-11 PP SCORING - NHL
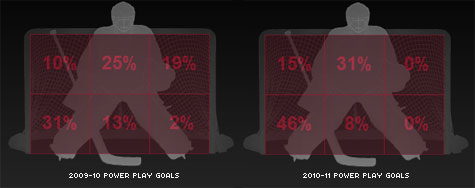
SHOOTING ZONE ON NET, 2009-10 PP SCORING VS 2010-11 PP SCORING - NHL
The San Jose Sharks have been concerned with the pace of even strength scoring vs. goals scored on the power play. In recent stretches it has been feast or famine. Prior to Thursday night’s contest against the New York Islanders, the Sharks ranked 22nd in the NHL in scoring with 36 goals in 13 games played. 19 of those goals came at even strength, 15 came on the power play (5th in NHL). The New York Islanders were ranked 25th in even strength scoring with 35 goals in 15 games played. 15 of those were scored even strength, 16 came on the power play (9th in NHL).
Patrick Marleau lead the Sharks with 3 even-strength goals (.133 shooting percentage). Joe Thornton (.312 shooting percentage) , Dany Heatley (.167 shooting percentage) and Joe Pavelski (.050 shooting percentage) are tied for the Sharks lead with 3 power play goals. Marleau is the only Sharks play to score short handed, scoring low blocker side.
The trend analysis shows that early in the 2010-11 season, the San Jose Sharks are scoring less from the wings, and have overloaded from the top of the slot. Even strength goals from directly in front of the net have declined 14% over the 2009-10 season, and 23% from the lower area of the ice. A lack of goals from the doorstep could explain a 0 shooting percentage for the top center zone of the net. Without enough bodies in front, chipping second and third attempts over a prone goaltender will not happen.
On the power play, goals scored on shots from the point have a similar success (38% vs. 37%), but are more spread out across the ice. Despite having the 5th ranked power play in the NHL, goals scored from down low have decreased 4%. The shooting zone of the net on the power play is decidedly more balanced. With an extra player on the ice to outnumber the defense, the Sharks are able to lift more pucks in the center top zone (36% vs. 0%) but have shyed away from the gloveside for left-handed goaltenders.
All data and graphics via NHL GameCenter.
[Update] Better Late than Never: San Jose Sharks – Behind the Net Hockey.